COU 2: Aggregating Information
Imagine a group of persons who must choose collectively between two alternatives. Suppose that all these persons share a common conception of the good (unrealistic, yes…but this is a model!), but that they are each uncertain about which of the two alternatives best serves that (common) good.
For instance, you might think of these persons as members of a labor union who are about to cast votes to decide whether to accept or reject a labor contract proposed by an employer. We can imagine that all these person share the common goal of achieving the best working conditions possible, all agree on what makes for good working conditions, but that each of them is unsure whether accepting or rejecting the proposed contract will best serve their shared objective.
Imagine each person’s personal experiences shed some light on, without fully determining, which alternative best serves the common good. For instance, continue to imagine the persons as workers voting on a labor contract. One worker might have worked the night shift at a previous job under a contract similar to the one the group is voting on. That worker’s experience will be informative about how working under the proposed contract might be for workers on the night shift, albeit not for workers on other shifts. Thus her unique experience as a night-shift worker is partially informative, but not fully determinative of, whether it’s best to accept or reject the contract. More generally, think of each person’s experience as distinct from that of the others in particular ways, and thus each person’s experience containing some distinct bit of information that is partially and uniquely useful for, but not determinative of, the judgement that all must make.
In such a situation, we can ask how the members of the group might aggregate their information – i.e. collect all the unique bits of information implied by the experiences of each individual person together so that all of it can all be brought to bear to make the most informed possible judgement about which alternative is best. In this COU, you’ll analyze models that explore information aggregation via voting. The models you’ll explore are all inspired by a collection of papers on the topic by Timothy Feddersen and Wolfgang Pesendorfer (for example Feddersen and Pesendorfer 1997). Analyzing them entails using techniques you’re learning in this lesson to analyze models of learning.
First, let’s build a model that depicts just one person’s experience being informative about which alternative best serves the group’s common conception of the good. Label the alternatives between which the group must choose A and B, and call the one person we’re focusing on “Charli”. Suppose that exactly one of two things is true:
- A in fact best serves the common good
- B in fact best serves the common good.
Suppose the marginal probability that A in fact best serves the common good is \frac{1}{2}, and thus that the marginal probability that B in fact best serves the common good is \frac{1}{2}. (Remember, we model marginal uncertainty just like any other uncertainty: The probabilities assigned to all the mutually exclusive resolutions must sum to 1. Here there are two mutually exclusive possible resolutions – A is best, B is best –, and so if the probability of one resolution is \frac{1}{2}, the probability of the other must also be \frac{1}{2}.)
Now imagine that the aspects of Charli’s personal experience that are informative about which alternative in fact best serves the common good can be summarized very simply. Specifically, exactly one of two things is true:
- All of Charli’s experiences, considered as a whole and weighing the negatives against the positives, together suggest (without definitively determining) that A best serves the common good.
- All of Charli’s experiences, considered as a whole and weighing the negatives against the positives, together suggest (without definitively determining) that B best serves the common good.
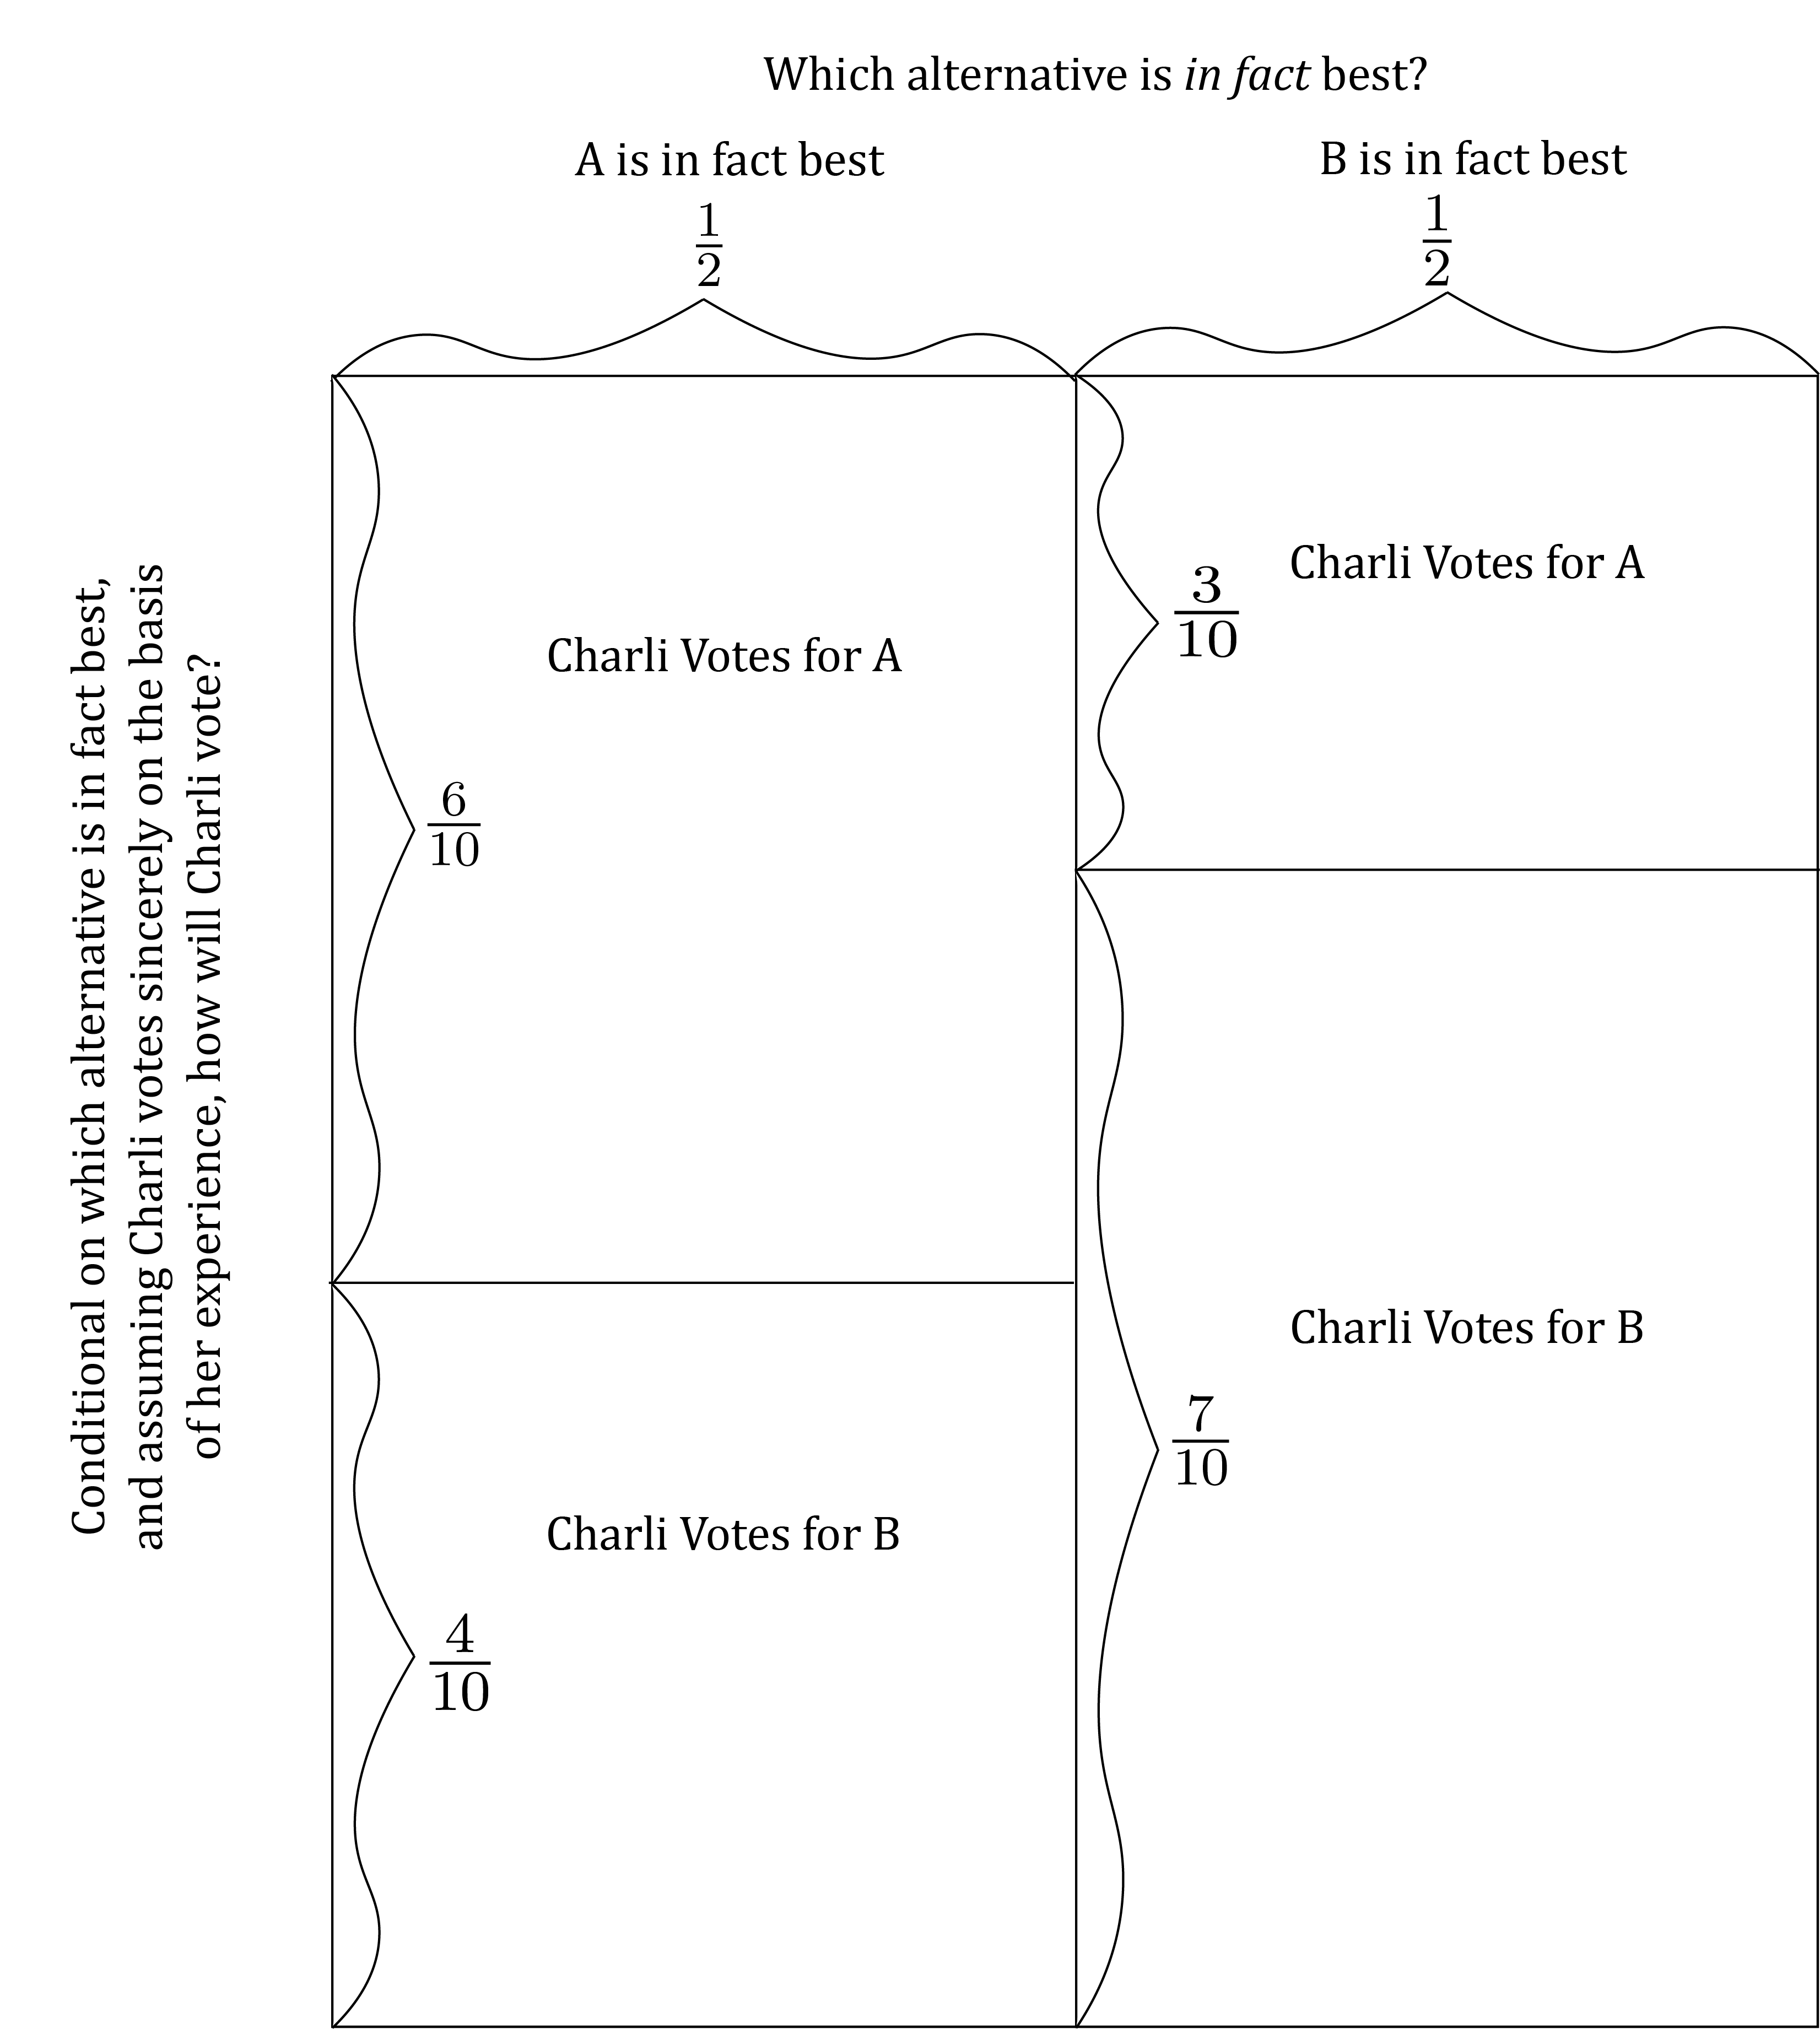
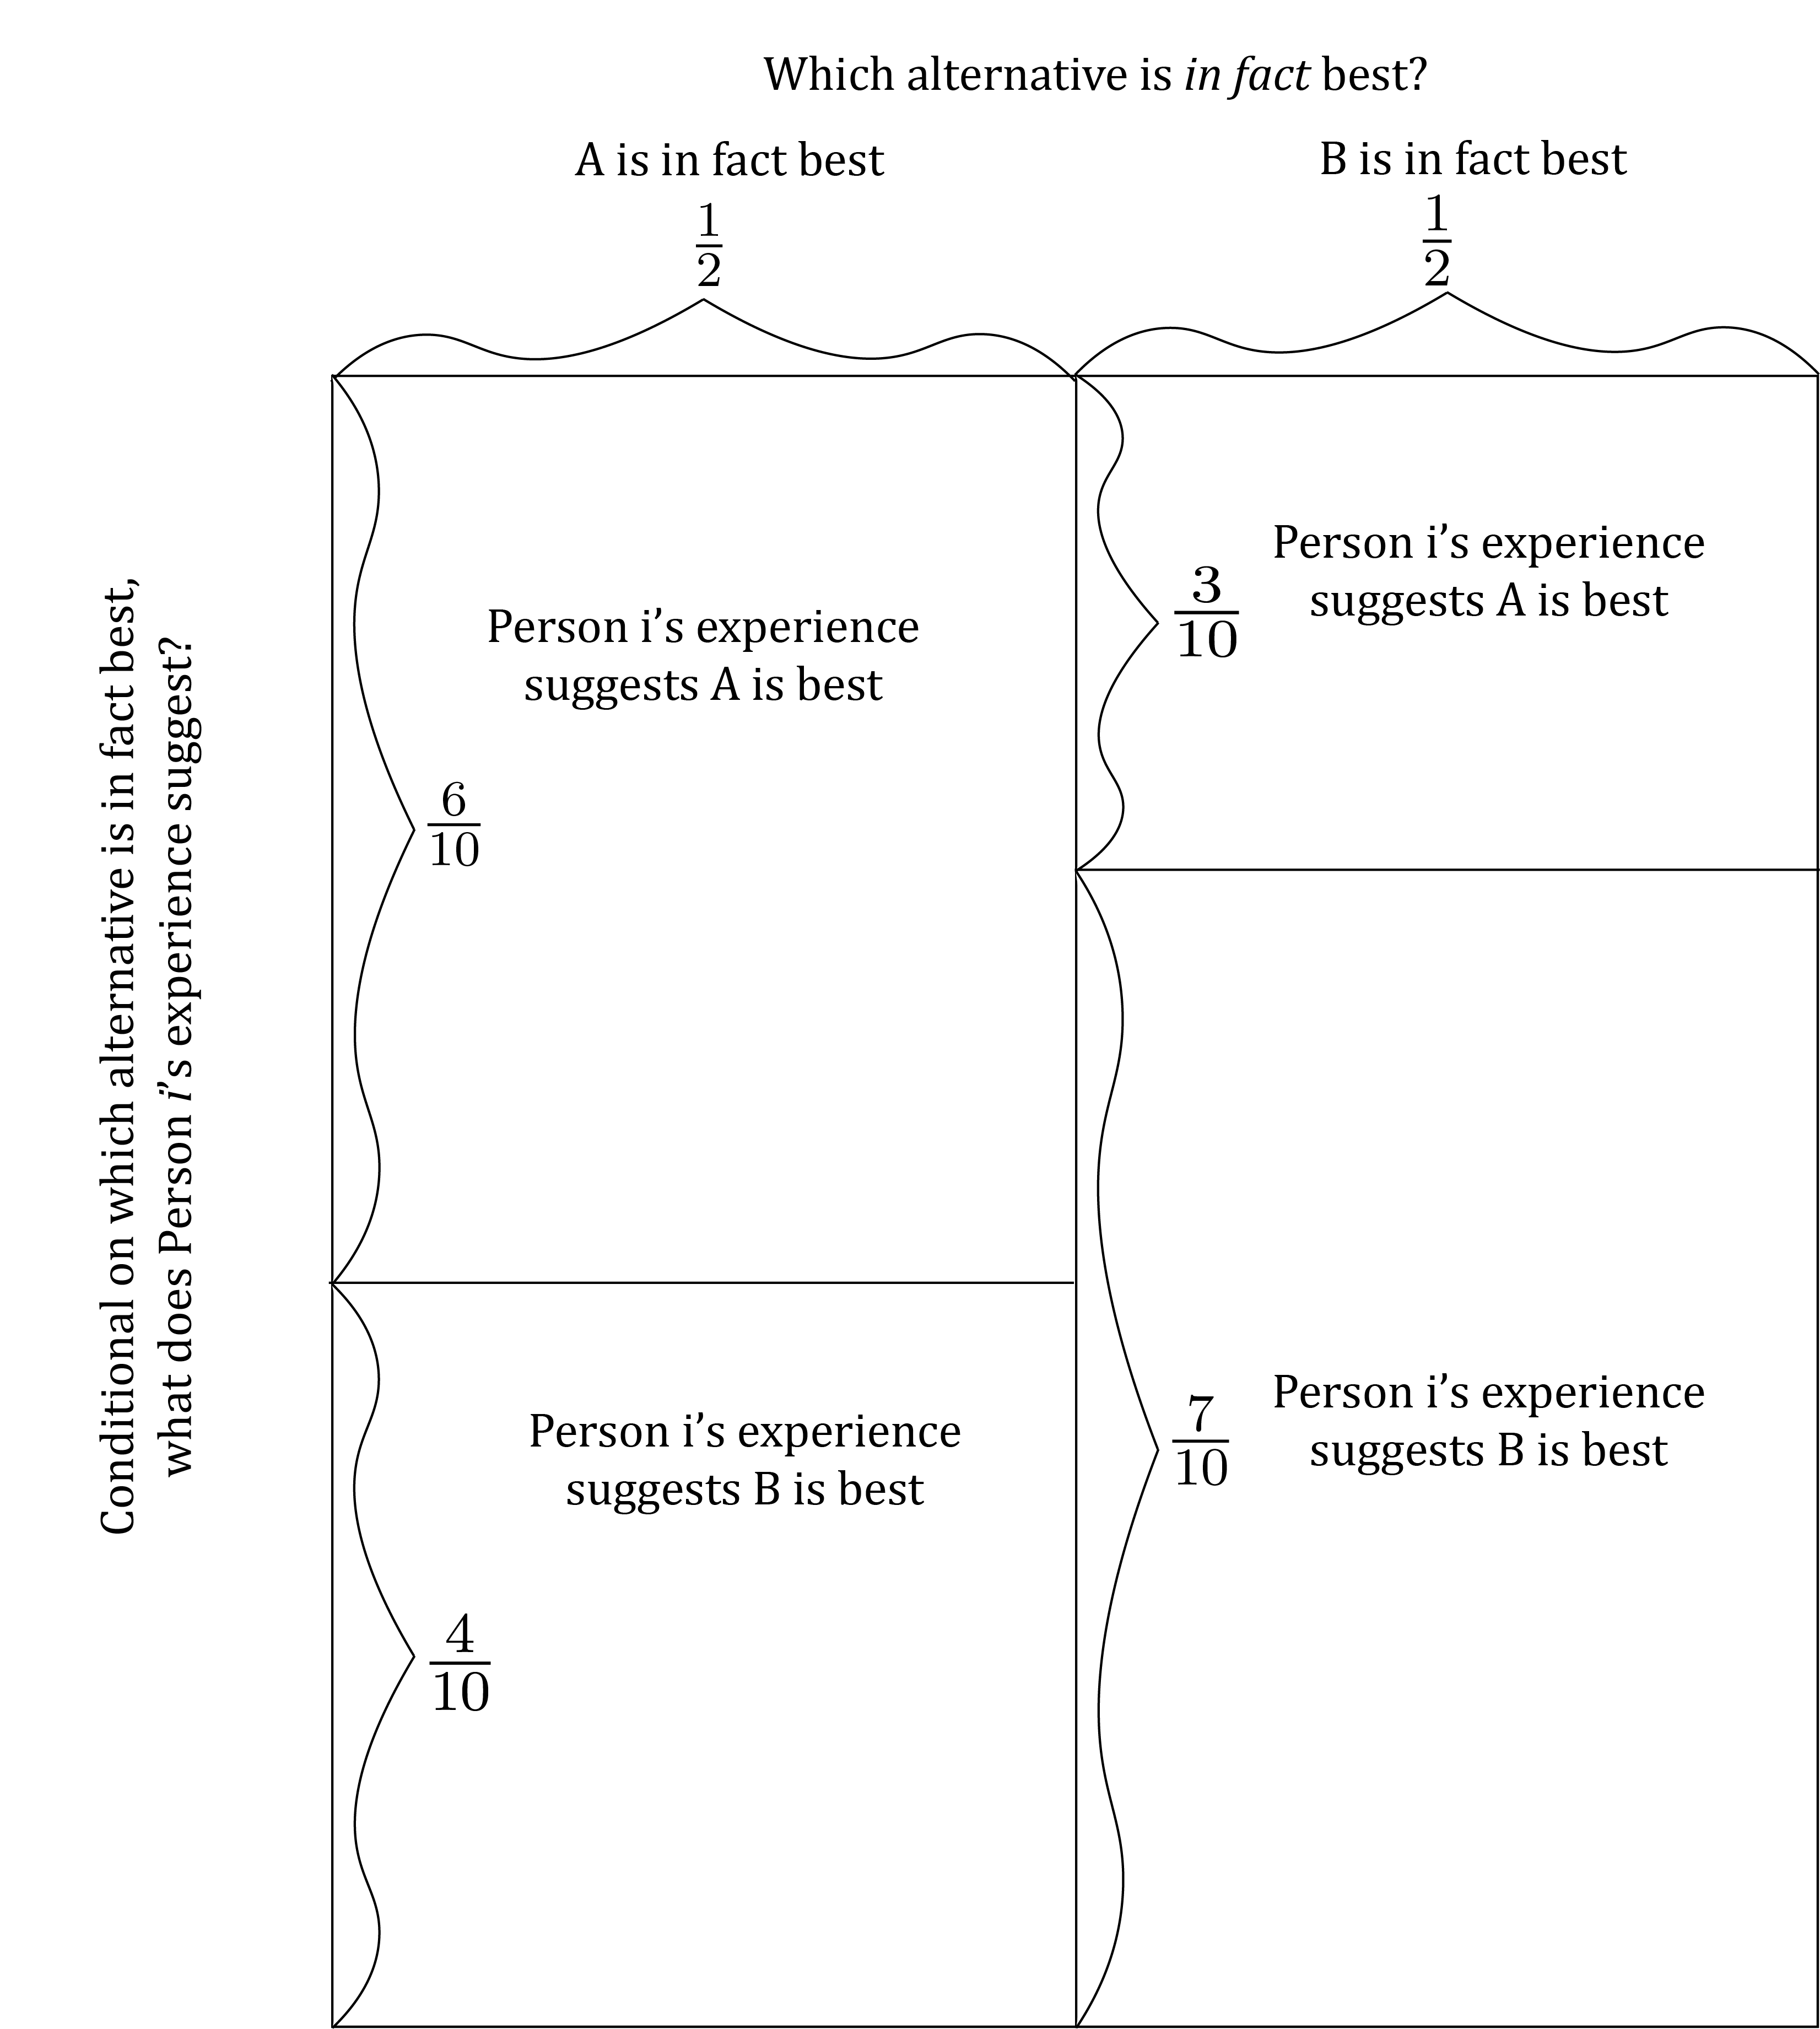
Suppose further that which alternative is in fact best affects the relative likelihood of Charli’s experiences suggesting that one alternative or the other is best. More specifically, if A is in fact best, Charli’s experiences are more likely to suggest that A is in fact best, and similarly for B. Model this as follows: P \left( \left. \begin{array}{c} \text{Charli's experiences suggest}\\ \text{that $A$ is best} \end{array} \right| \text{$A$ is in fact best} \right) = \frac{6}{10} P \left( \left. \begin{array}{c} \text{Charli's experiences suggest}\\ \text{that $B$ is best} \end{array} \right| \text{$B$ is in fact best} \right) = \frac{7}{10}
All this implies a probabilistic model of uncertainty about which alternative is in fact best and which alternative Charli’s experiences (taken as a whole and balancing the negatives against the positives!) suggest is best. Here is a Marginal-Conditional Diagram specifying the model:

Make sure you notice how the model captures the most critical aspects of the situationn we hope to explore. First, the model depicts Charli’s experiences as to some extent informative about which alternative is in fact best. To see this, note that if A is in fact best, Charli is more likely than not to have experiences that suggest A is best, and similarly with B. Second, although they are informative, Charli’s experiences are not definitive as a basis for judging which alternative is best. To see this, note that if A is in fact best, there is a positive probability that Charli’s experiences will incorrectly suggest that B is best, and similarly for B.
Together, these two fact about the situation suggests that we would want to take account of Charli’s experience in deciding between A and B. But it would be even better if we could combine (or aggregate) the implications of Charli’s experience with the informative-but-not-wholly-determinative experiences of others.
Part 1: Sincere Voting
Now that we have a model of Charli and her experience, let’s think again about the group as a whole and how all their information might or might not be aggregated to make the best-informed decision between A and B.
Notice that in the model as we’ve specified it so far, Charli’s personal experiences all boil down to a binary suggestion – either (taken as a whole and balancing the positive against the negative) her experiences suggest A is best or they suggest B is best. With this in mind, imagine the group decides to choose between A and B by voting. Note that in any vote in which there are two alternatives on the ballot, each voter’s vote is binary. So, if the group holds a vote to decide whether to adopt A or B, Since both Charli’s information and her vote are binary, Charli’s vote can transmit all the relevant information contained in her personal experience. More specifically, if Charli in casting her vote considers only her personal experience, notes whether those experiences overall suggests that A or B is better, and then votes accordingly, her vote will exactly correspond to the unique information she has to contribute to the group’s decision. In PPT models of information aggregation, this kind of voting behavior, in which a person votes purely on the basis of the unique information they have to contribute to the decision, is called sincere voting.1
If Charli votes sincerely – again, votes for A if her experience suggests A is best and votes for B if her experience suggests B is best – then we can directly transpose the model above of Charli’s experience to a model of Charli’s vote:
If Charli votes sincerely, then whichever alternative Charli votes for is more likely than not to be the alternative that is in fact best. Show this by doing the following:
- Compute the conditional probability P(\text{A is in fact best} | \text{Charli votes for A}). Write the result as a fraction, not a decimal number.
- Compute the conditional probability P(\text{B is in fact best} | \text{Charli votes for B}). Write the result as a fraction, not a decimal number.
- Copy the diagram above and mark it up to show how you computed the results you wrote in responses to (i) and (ii)
You are not required to simplify the fractions you compute in response to (i) and (ii), although you are welcome to do so if you want to. For instance, writing something like… \frac{\frac{3}{8}\times\frac{9}{10}}{\frac{3}{8}\times\frac{9}{10} + \frac{5}{8}\times\frac{7}{24}} …would be perfectly fine, if it were a correct answer.
All of the above suggests that information aggregation via voting might work! Here’s the idea: Each person in the group has their own unique personal experiences, and each person’s experiences can be boiled down to imply a uniquely-informed binary judgement – suggesting on balance that either A is best or B is best. Each person’s vote, like her personally-informed binary judgement is also binary. Thus each person can input the implications of her uniquely informative experiences into the process simply by voting solely according to the (again, binary) implications of her unique experiences.
For instance, suppose that there are 3 persons in the group (we’ll use an odd number so we don’t have to worry about ties under majority rule.) To distinguish one person from another, assign them numbers, as in “Person 1”, “Person 2”, and “Person 3”. When we want to refer to any generic person, without specifying exactly which one we’re talking about, we’ll say “Person i”. Suppose that the overall implications of each person’s unique personal experiences for the purpose of the decision work just like Charli’s. Specifically, if we take any Person i, the overall implications of his experiences are related to which alternative is in fact best like this:
Now imagine that each person votes sincerely on the basis of the implications of her experience. For instance, if Person 1’s experience overall suggests that A is best, Person 1 votes for A; If Person 2’s experience overall suggests that B is best, Person 2 votes for B; Etc. Then you can show2 that the vote count – i.e. the number of votes cast for each alternative – will be related to which alternative is in fact best like this:
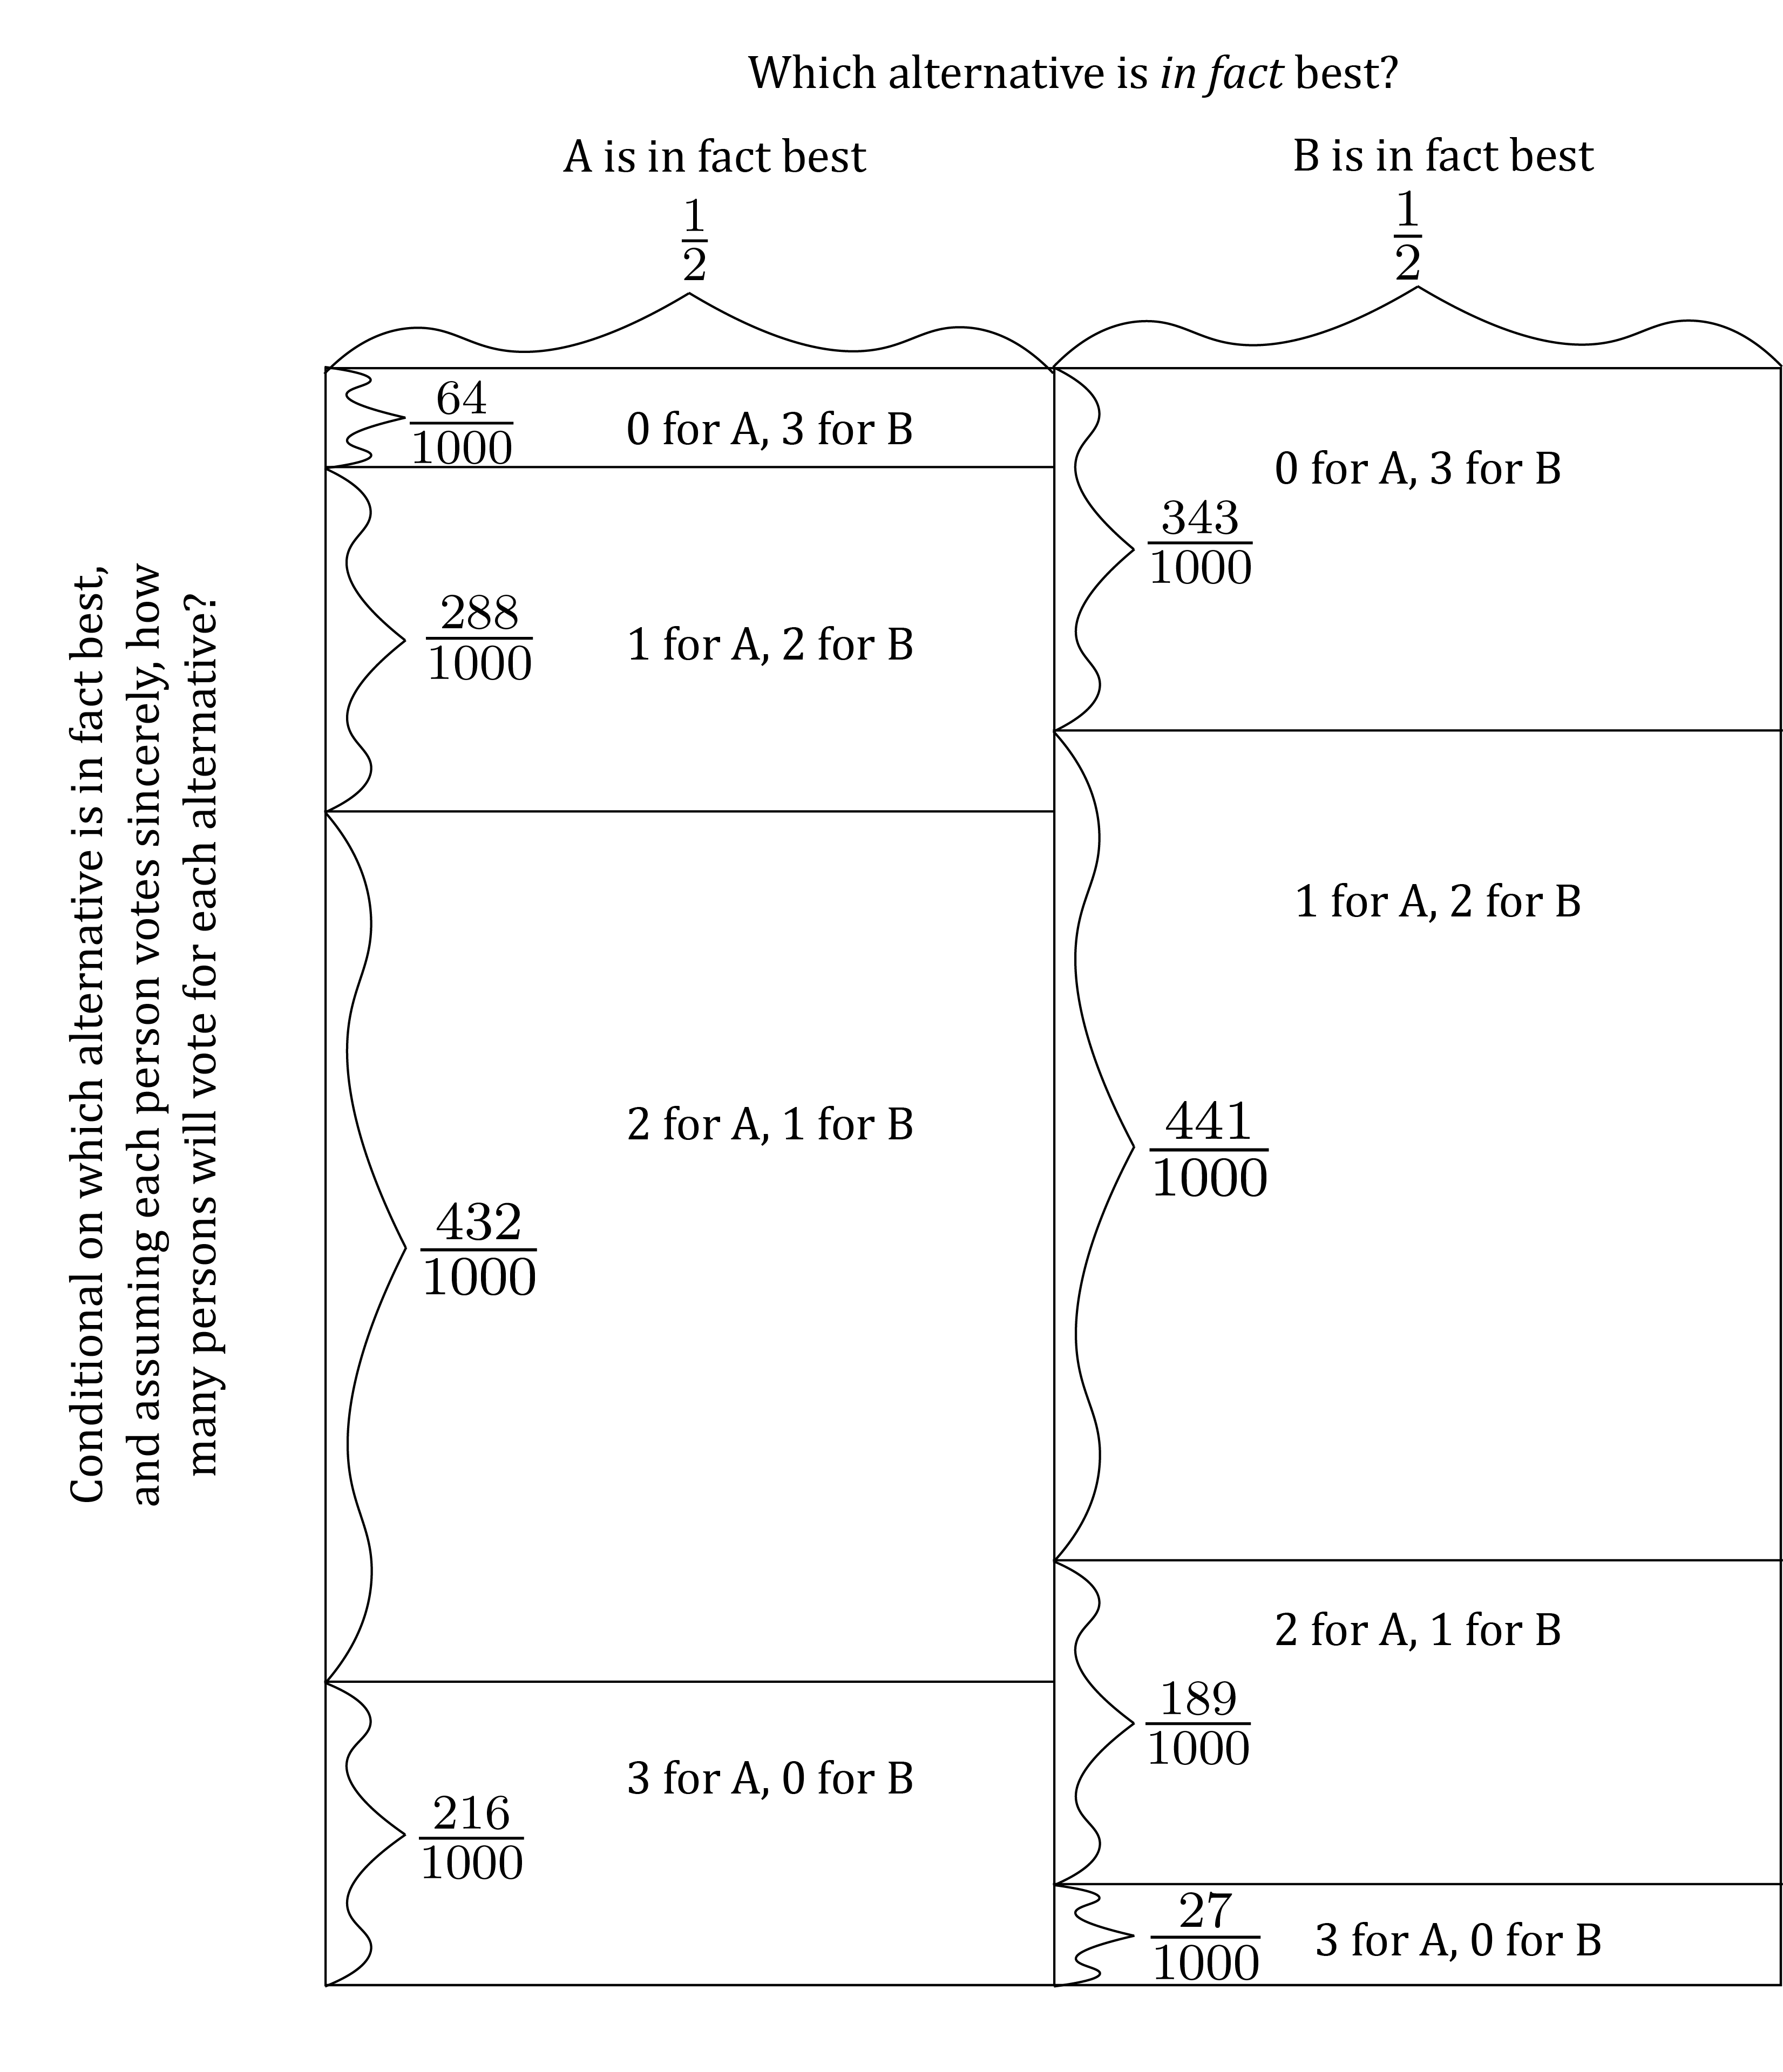
There’s something remarkable about the probability distribution described by the diagram above. To see it, suppose that A is in fact best. Notice that conditional on the event that A is in-fact best, the most likely event is that 2 votes are cast for A and 1 vote is cast for B. Similarly, notice that conditional on the event that B is in fact best, the most likely event is that 1 vote is cast for A and 2 votes are cast for B. In other words, conditional on whichever alternative is best, the most likely outcome is that that alternative gets a bare majority of votes. Indeed, as the number of people in the group gets larger, the conditional probability that the correct alternative gets a bare majority grows, approaching 1 in the limit as the size of the group goes to infinity.
This suggests a special connection between information aggregation and majority rule: When a group of persons share a common view of the good, and each one votes sincerely between two alternatives based solely on her unique information about the alternatives, majority rule (as opposed to other voting rules, such as unanimity rule) maximizes the likelihood that the better alternative will be selected. This intuition was formalized in a mathematical theorem in one of the first works of PPT, published in 1785 by a French aristocrat and mathematician called the Marquis de Condorcet. (Condorcet was beheaded a few years after he published this work as part of the wave of mass executions by guillotine in which the French Revolution culminated. Insert joke here about being good at PPT not being the same thing as being good at real-life politics. Also insert joke here mocking people who spend time theorizing about politics among persons who share a common view of the good.)
A basic assumption of this model is that no person has the ability to know with certainty which alternative is in fact best. With this in mind, imagine that you witness the three persons cast votes just as described in the model above. After they’ve cast their votes, thus making their final choice between A and B, there’s no reason to think that any of them will ever find out for sure whether A or B is in fact best. After all, they will presumably implement the decision that wins a majority, and never get to find out what would have happened had they instead implemented the other alternative.
That said, if they have each voted sincerely, so that the above Marginal-Conditional Diagram describes the relationship between which alternative is in fact best and the vote count, then an observer can learn about which alternative is best (which presumably cannot be directly observed) by observing the final vote count.
- Using the Marginal-Conditional Diagram above, compute P(\text{$A$ is in fact best} | \text{$2$ votes are cast for $A$ and $1$ for $B$}). Write the result as a fraction, not a decimal number.
- Using the Marginal-Conditional Diagram above, compute P(\text{$B$ is in fact best} | \text{$1$ vote is cast for $A$ and $2$ votes for $B$}). Write the result as a fraction, not a decimal number.
- Copy the diagram above and mark it up to show how you computed the results you wrote in responses to (i) and (ii)
You are not required to simplify the fractions you compute in response to (i) and (ii), although you are welcome to do so if you want to. For instance, writing something like… \frac{\frac{3}{8}\times\frac{9}{10}}{\frac{3}{8}\times\frac{9}{10} + \frac{5}{8}\times\frac{7}{24}} …would be perfectly fine, if it were a correct answer.
Part 2: Incentives to Vote Sincerely?
So far, we’ve shown that if every person in the group votes sincerely – again, meaning that each person votes only on the basis of the unique implications of her own experience for the group’s choice – then majority rule most effectively aggregates all of the information useful to the group. So it seems that it would be a good thing if the group decided between its alternatives by majority rule, and if each member of the group participated in that vote by voting sincerely. With these notions in mind, we’ll now turn to investigating the extent to which any one member of the group has an incentive to vote sincerely when the group decides by majority rule.
Think again of our one particular member of the group, Charli. Imagine the group has decided to choose between the available alternatives A and B by a majority-rule vote. Further, imagine that Charli expects that her fellow group members will each vote sincerely. Specifically, letting “Person i” be any member of the group other than Charli, suppose that Charli expects that if Person i’s experience suggests that A is the better choice for the group, then Person i will vote for A; And if Person i’s experience suggests that B is the better choice for the group, then Person i will vote for B.
Now imagine Charli deciding how to cast her own vote. To analyze her choice, think of the case in which Charli’s personal experience suggests that A is the better choice for the group. (The other case where her experience suggests B is the better choice works by the same logic.) In this case, Charli voting sincerely would mean Charli voting for A. Should she? Imagine Charli thinking through how she should vote as follows:
Wow…This makes me really nervous. My personal experience suggests that A is the better choice for the group. But that’s just my personal experience. Each one of my fellow group members has their own experience which casts additional light on which alternative is better. So just because my personal experience suggests that A is the better choice does not mean A is the better choice. What if I vote for A and that turns out in fact that B is the best choice???
Imagine Charli being overwhelmed for a moment by anxiety about the possibility that she might vote for A when in fact B is the better alternative. Then imagine that to calm herself down she thinks:
OK, calm down. It’s not the end of the world if I vote the wrong way, right? After all, we’re deciding by majority rule. And that means that my vote might not even matter. If more than half of my colleagues all vote for one of the alternatives, then that alternative will get a majority of our votes regardless of how I vote. In that circumstance, it won’t matter if the vote I cast happens to be wrong.
This thought helps Charli relax a bit. And it also clarifies for her the situation she’s in. She thinks:
Now that I think about it, I realize that to contribute as best I can in this situation, I need to focus only on the circumstance in which my vote has an effect on the outcome. That’s the only circumstance that matters, because in every other circumstance how I vote has no effect on which alternative we select. Further, my vote affects the outcome only when exactly half of my colleagues cast their votes for A and the other half cast their votes for B. In that case – and only in that case – my vote is determinative of which alternative we select as a group. So, I should decide how to vote assuming (regardless of whether it is actually true) that half my colleagues will vote for A and half will vote for B.
So, Charli now asks herself the question that she realizes is the question that truly matters in deciding how she should vote: If her personal experience suggests that A is the better alternative, should she vote for A assuming that exactly half her colleagues vote for A and the other half vote for B? That, after all, is the only case in which her vote affects the outcome. So if she wants to do right by herself and her colleages, she had better be sure that voting for A is the right choice in that case. Is it?
To help think this through, suppose that there are only three persons including Charli in the group as a whole. In that case, Charli’s vote determines the outcome when one of the persons other than Charli votes for A and one of the persons other than Charli votes for B. And if Charli supposes that her colleagues cast their votes sincerely, that circumstance occurs only when one of her colleague’s personal experience suggests that A is the better choice and the other colleague’s personal experience suggests B is the better choice. So, Charli must choose the alternative she ought to vote for knowing that her own experience suggests A is the better choice and assuming that one of her colleague’s experience suggests that A is the better choice and the other of her colleague’s experience suggest that B is the better choice.
Using calculations similar to those we used in the previous section to model the number of persons voting for each alternative in a group of three persons when each person votes sincerely,3 we can model whether Charli’s experience suggests A or B is best and how many of the two persons in the group other than Charli have experiences that suggest either A or B is best as follows:
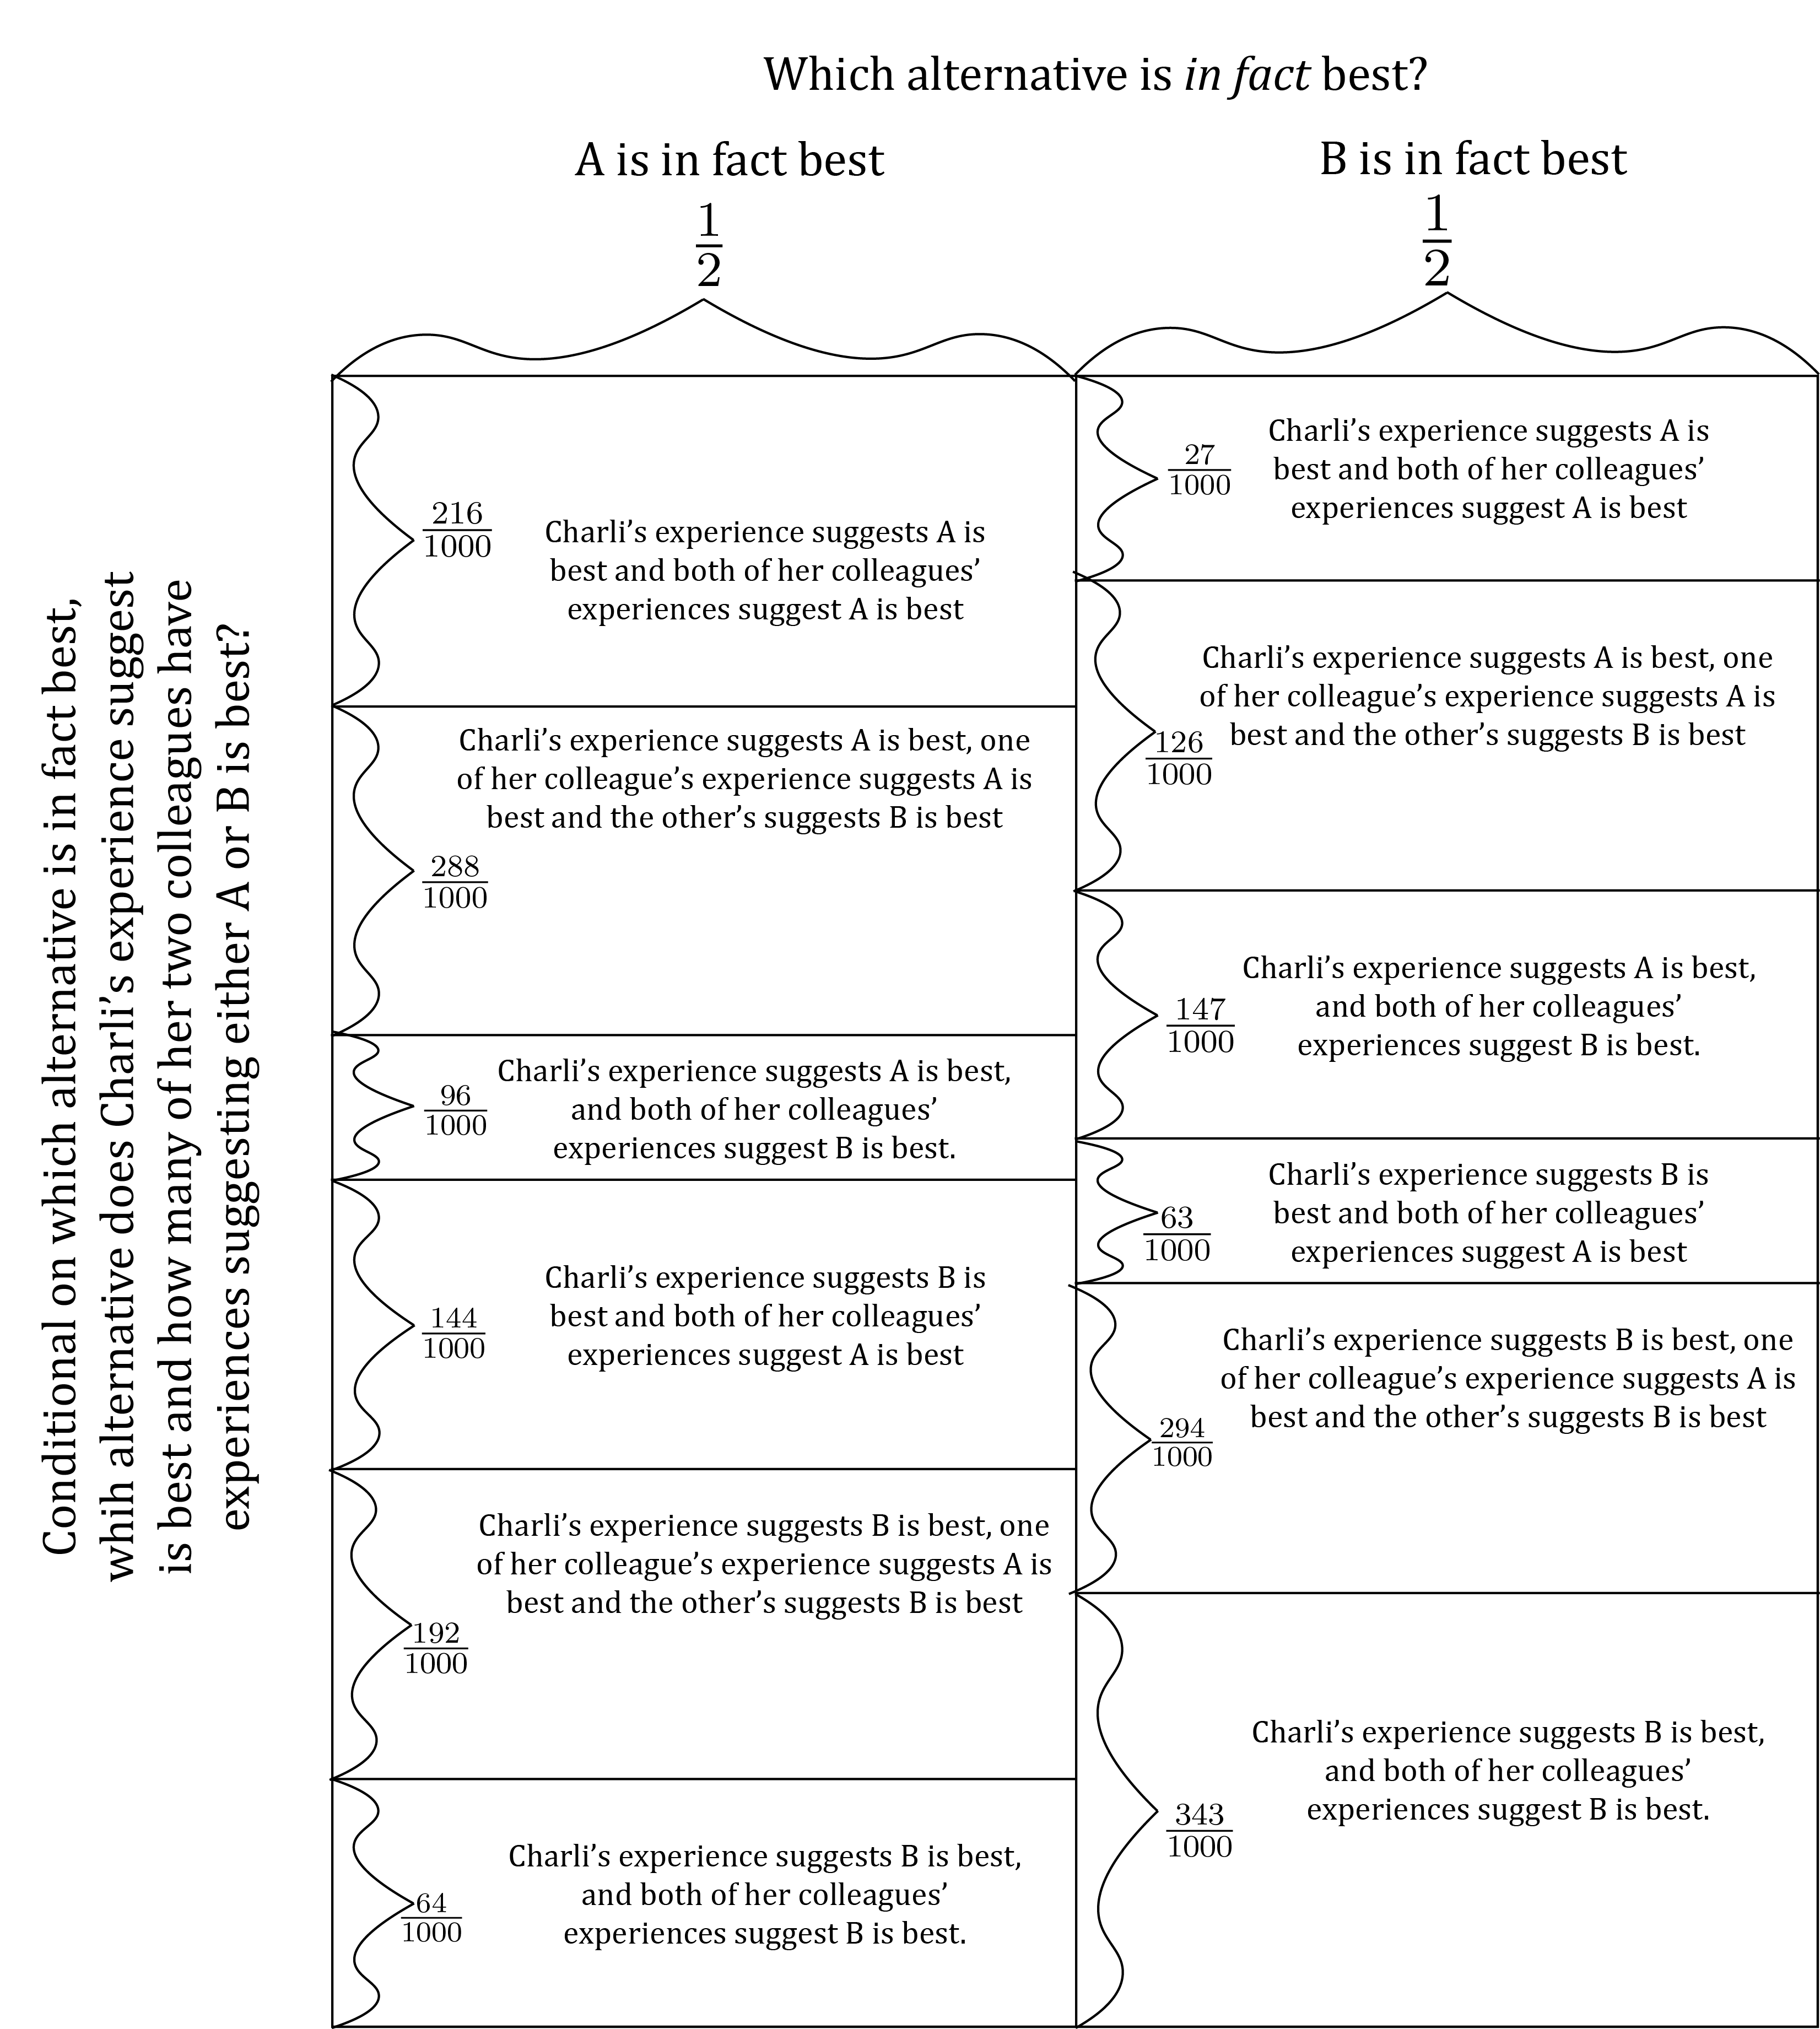
To be clear, the conclusion of all this reasoning is that Charli should not cast her vote purely on the basis of what her own experience suggests, and thus that she should not engage in sincere voting. Instead, when Charli’s experience suggests that A is best, she should vote as if her personal experience suggests A is best, 1 of her colleague’s personal experience suggests A is best, and 1 of her colleague’s personal experience suggests B is best.
All that said, it is concievable that when Charli’s personal experience suggests A is best, 1 of her colleague’s personal experience suggests A is best, and 1 of her colleague’s personal experience suggests B is best, the best thing for Charli to do is to vote for A – exactly as she would if she were voting sincerely when her personal experience suggests that A is best. You might think this is the case if:
\begin{array}{l} P\left(\text{$A$ is in fact best} \left| \begin{array}{c} \text{Charli's experience suggests $A$ is best,} \\ \text{one of her colleague's experience suggests $A$ is best}\\ \text{and the other's suggests $B$ is best} \end{array} \right. \right) \geq \\\\ P\left(\text{$B$ is in fact best} \left| \begin{array}{c} \text{Charli's experience suggests $A$ is best,} \\ \text{one of her colleague's experience suggests $A$ is best}\\ \text{and the other's suggests $B$ is best} \end{array} \right. \right) \end{array} Using the Marginal-Conditional Diagram above…
- Compute the fractions on each side of the inequality above. Write the results as fractions, not decimals.
- Copy and mark up the diagram to show how you did the computations.
- Write whether or not the inequality holds.
Rubric
Prompt 1A
You can earn up to six points on this prompt, specifically up to three points for each of parts (i) and (ii). Specifically:
- 3 points if what you write is correct and what you draw in response to (iii) correctly shows how you calculated the result;
- 1 point if what you write is correct but you do not draw a diagram in response to (iii) that correctly shows how you calculated the result;
- 0 points otherwise
Prompt 1B
You can earn up to six points on this prompt, specifically up to three points for each of parts (i) and (ii). Specifically:
- 3 points if what you write is correct and what you draw in response to (iii) correctly shows how you calculated the result;
- 1 point if what you write is correct but you do not draw a diagram in response to (iii) that correctly shows how you calculated the result;
- 0 points otherwise
Prompt 2
For part (a), you earn up to three points for what you calculate for each of the two expressions on the opposite sides of the inequality. Specifically:
- 3 points if what you write is correct and what you draw in response to (b) correctly shows how you calculated the result;
- 1 point if what you write is correct but you do not draw a diagram in response to (b) that correctly shows how you calculated the result;
- 0 points otherwise
For part (c), you earn one point if you give the correct answer and zero points otherwise.
References
Footnotes
Caution: “Sincere voting” is used by political scientists in other contexts to refer to totally different things. So don’t assume that the sense in which it is used here is the one meant when you see the term in other classes.↩︎
To be clear, you do not need to be able to show this or know why it’s true! Just take this as given and don’t worry about how it’s derived. If you want to know how, take more PPT classes. Or ask about it in office hours.↩︎
Again, you do not need to know how to do these calculations. Just take the results as given. If you want to know how to do the calculations, take more PPT classes or ask about it in office hours.↩︎