COU 4: Graphing a Tent-Shaped Utility Function
Instructions
Prompt 1
The graph below shows locations in a policy space ranging from -4 to 4 on the horizontal axis, and a person’s utility level on the vertical axis. Suppose this person has single-peaked preferences described by a tent-shaped utility function with ideal point I as marked on the horizontal axis.
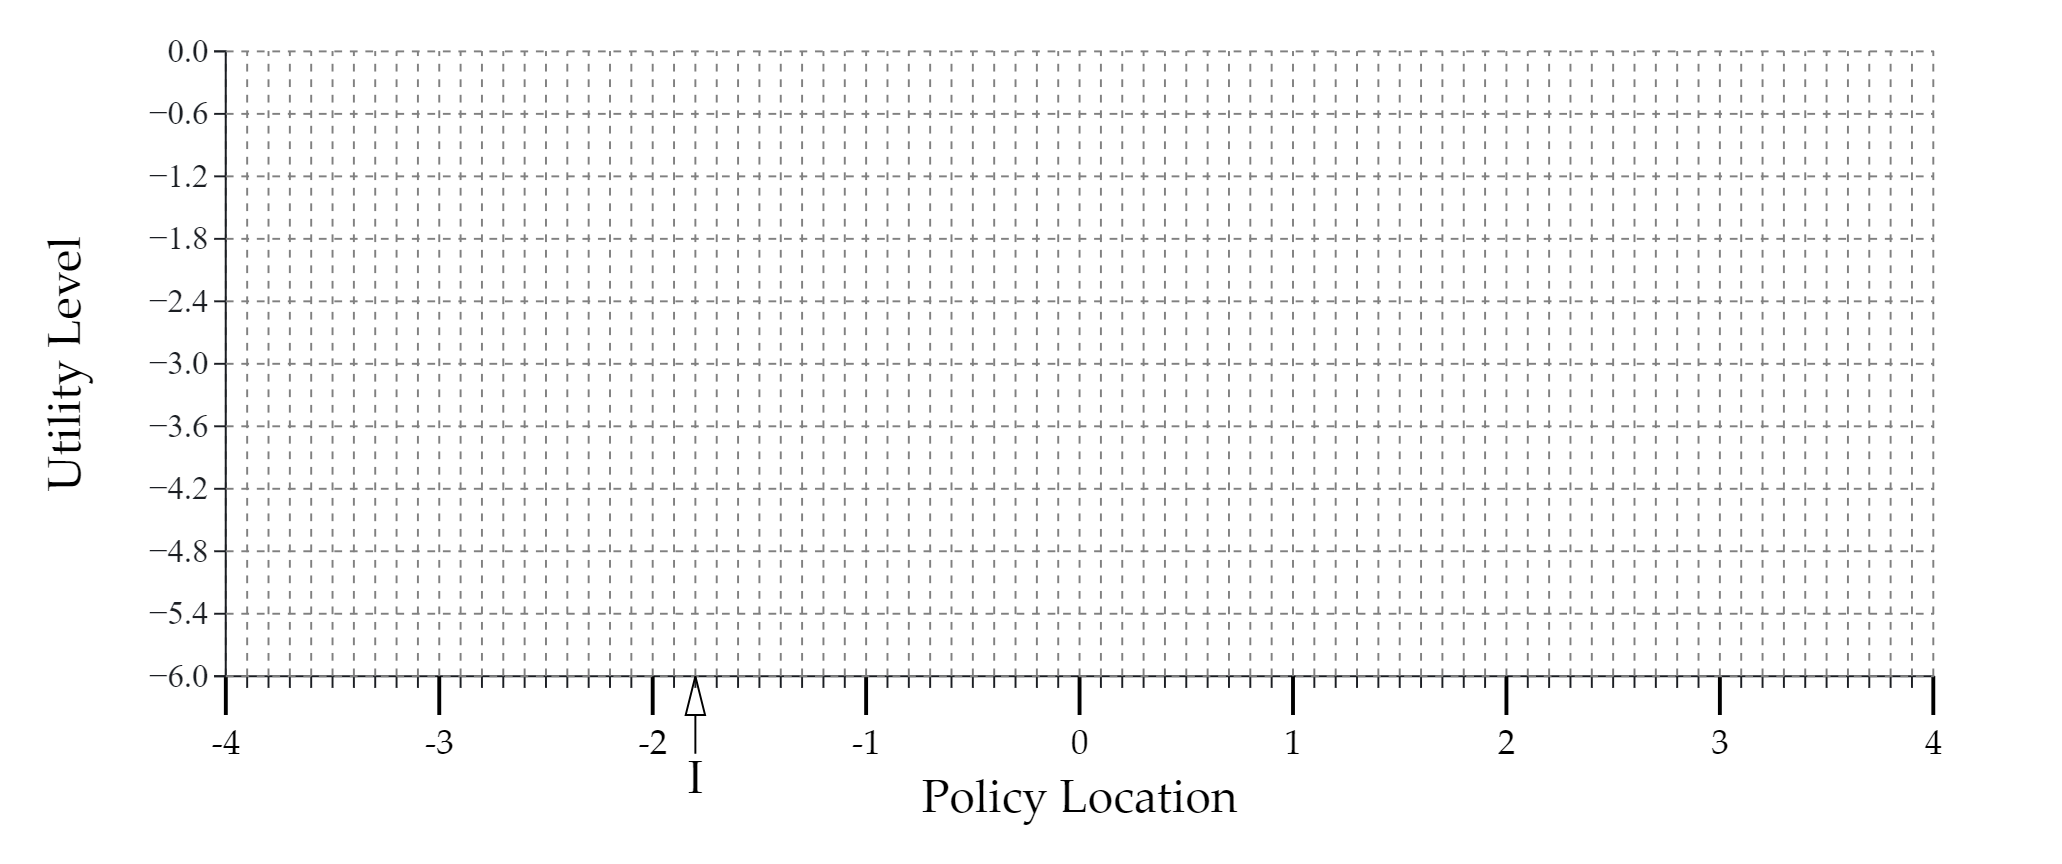
Use the graph to draw the person’s utility level as a function of the location x of policy. Remember, given the location x of policy and the location I of a person’s ideal point, the tent-shaped utility function is U(x;I) = - | x-I |. Use the tick marks on the vertical axis to make sure the the level of the utility function you draw is approximately correct at each location along the horizontal axis.
Prompt 2
Now consider three policies at locations A, B, and C as follows:
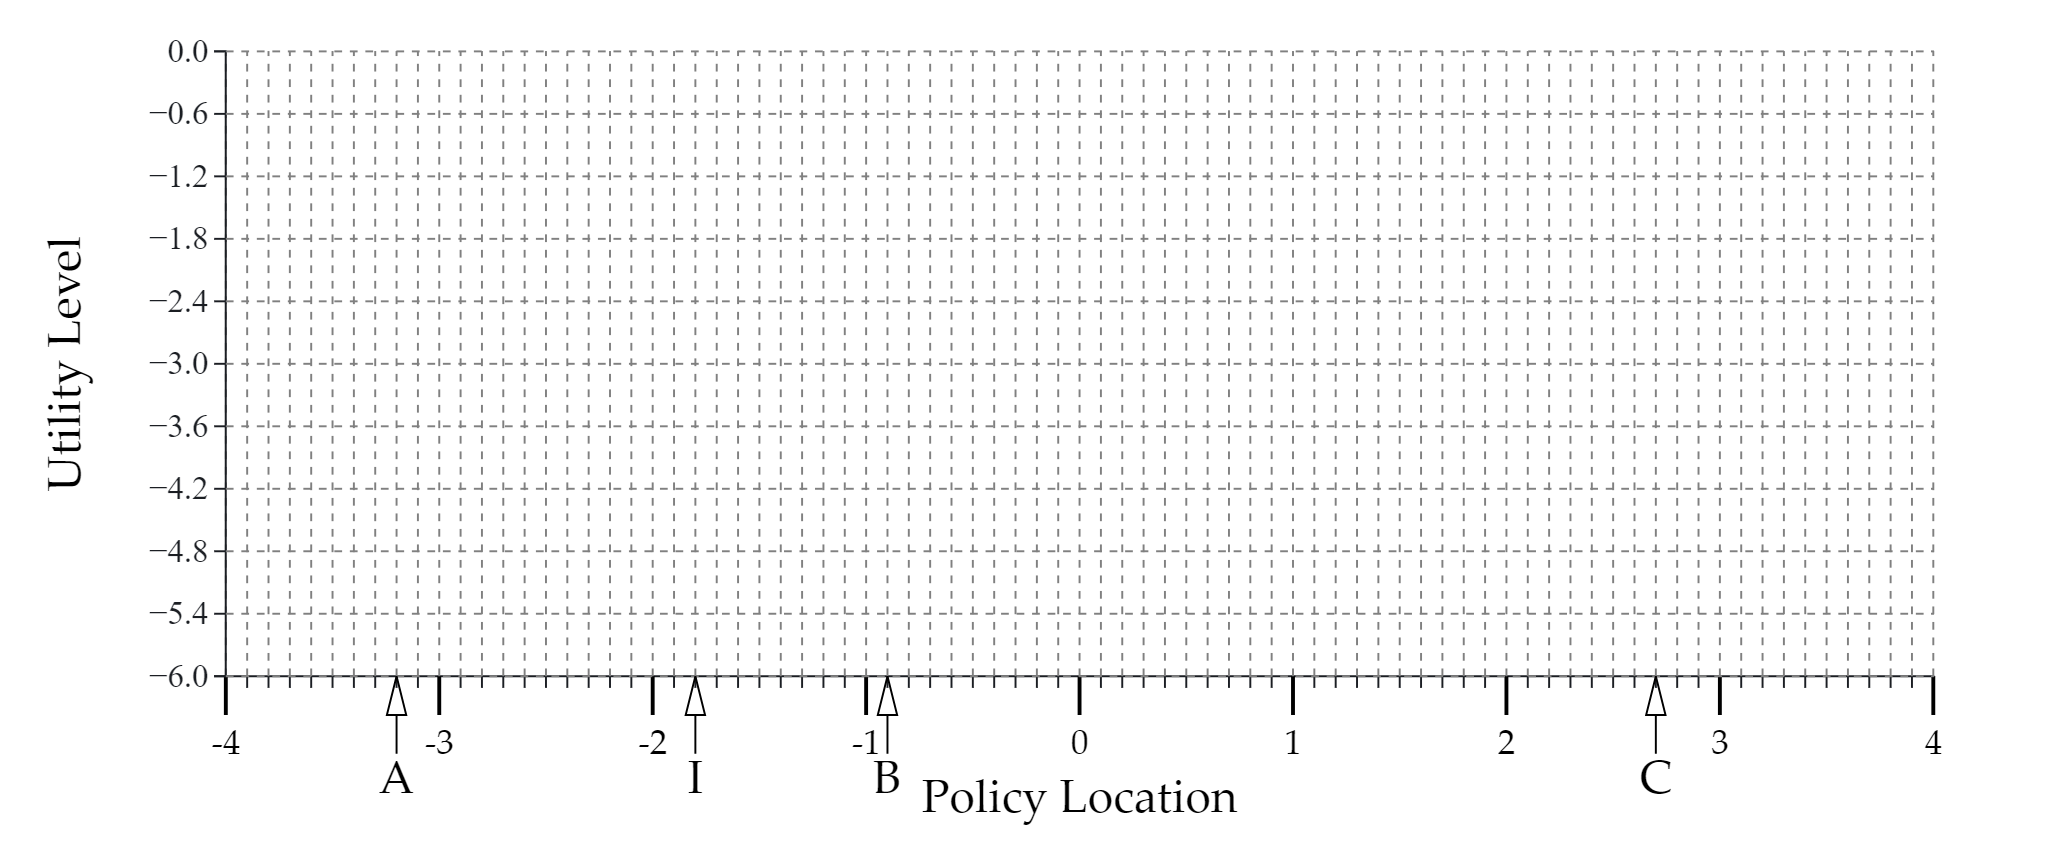
First, draw the graph of the tent-shaped utility function for a person with ideal point located at the point marked ‘I’ on the horizontal axis. Notice that since the location I in this prompt is exactly the same as the location marked ‘I’ in prompt 1, the graph of the utility function you draw for this prompt should be identical to the graph you drew for Prompt 1! Second, use dotted lines to trace the locations of each of the policies A, B and C up to the utility level that the utility function you’ve drawn assigns to the policy.
Prompt 3
For each of the policies A, B and C pictured in Prompt 2, write the approximate utility level assigned by the utility function you drew in response to the prompts.
Prompt 4
Write the preference ordering over policies A, B and C of the person whose preferences are represented by the utility function you drew in response to Prompts 1 and 2.
Rubric
Prompt 1
You can earn up to 1 point on Prompt 1. You earn 1 point if you draw a graph that correctly depicts the utility level assigned at every location on the horizontal axis. You earn 0.5 points if you draw a graph that is tent-shaped, with the peak of the tent located at the correct point on the horizontal axis but an incorrect level of the graph is incorrect at one or more locations on the horizontal axis. You earn 0 points otherwise.
Prompt 2
You can earn up to 3 points on Prompt 2. To earn more than 0 points, you must first of all draw a tent-shaped graph with the peak at the correct location along the horizontal axis. If you do not draw a tent-shaped graph with a correctly located peak, you get 0 points regardless of what else you draw. If you draw a tent-shaped graph with a correctly located peak, but the level of the graph is incorrect at one or more points, we evaluate the other elements of what you’ve drawn as if the levels you drew are all correct. Specifically, you earn 1 point for correctly tracing the utility levels assigned by the graph you’ve draw at each of the policies A, B and C.
Prompt 3
You can earn up to 3 points on Prompt 3. To earn more than 0 points, you must have earned 3 points on Prompt 2. If you earned 3 points on Prompt 2, then you earn 1 point on this prompt for each of the correct approximate utility levels you write. The levels you write must match the levels indicated in the lines you traced in Prompt 2. They must match even if the levels of the graph you drew in Prompt 2 are incorrect!
Prompt 4
You can earn up to 3 points on Prompt 4. To earn more than 0 points, you must have earned 3 points on Prompt 3. If you earned 3 points on Prompt 3, then you earn 1 point on this prompt for each unique pair of the policies A B and C for which you provide a ranking that matches the relative utility levels you wrote in response to Prompt 3.