Bethany Tallis
In this section, our aim is to attempt to understand what could explain variation in tenant appearance at Landlord/Tenant court within the city of Rochester in 2017. Variation in tenant appearance is important because without a tenant present, an immediate warrant is more likely to occur if the landlord and their attorney is present. There are two relatively broad categories which we have chosen to analyze: timing and weather.
Does weather impact tenant appearance? Does the Rochester City School District calendar impact appearance? How about day of week, day of month and month of the year? All of these variables will be tested against our dataset, to see if there are any significant findings.
Timing
Rochester City School District Calendar
One might think that when schools are not in session it is less likely for tenants to appear in court, due to being unable to obtain childcare. The following graph compares appearance rates on days when RCSD is in session to days when it is out of session.
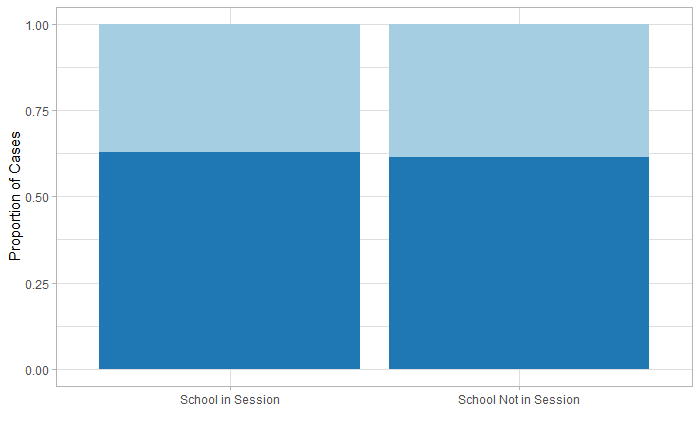
The light blue portion of the graph indicates the proportion of cases in which no tenant was present, whereas the dark blue portion indicated the proportion of cases in which at least one tenant was present.
The above graph shows the proportion of tenants who are present when schools are in session compared to when schools are out of session. As can be seen from the above graph, tenant appearance doesn’t vary a lot depending on whether the local schools are in or out of session.
Day of the Week
It’s possible that variation may occur in tenant appearance throughout a typical week, if for example Mondays are Fridays are easier for tenants to take off work.
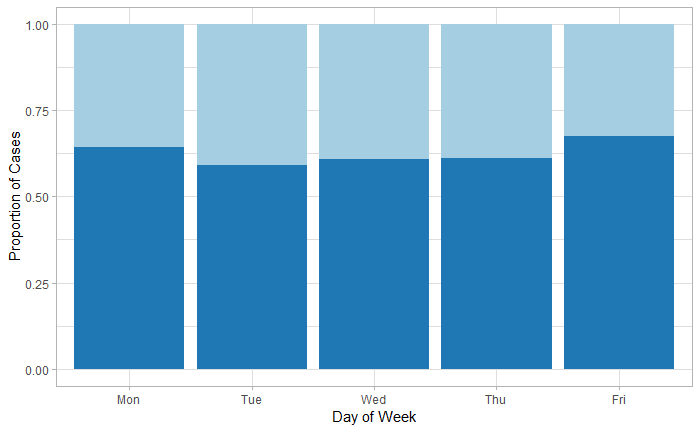
The light blue portion of the graph indicates the proportion of cases in which no tenant was present, whereas the dark blue portion indicated the proportion of cases in which at least one tenant was present.
The day with the highest tenant appearance rates tends to be a Friday. It could be that Fridays are easier for tenants to get off work, or that days closer to the weekend are more preferable for tenants to request off from work. The day with lowest appearance was a Tuesday (59%) compared to the day with highest appearance which was a Friday (68%). However, these differences are small relative to our sample size, so we do not have reason to think that these differences appear in the full population of cases.
Day of Month
One might think that tenant appearance could be affected by the day of month on which their trial occurs. One might be interested to understand how paychecks and salaries affect variations in the appearance over a month long period.
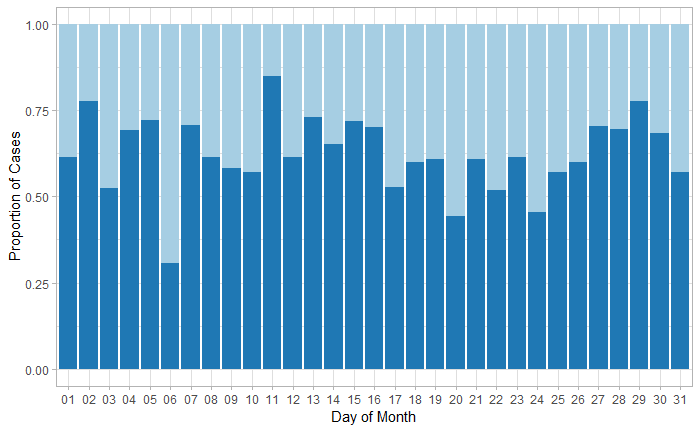
The light blue portion of the graph indicates the proportion of cases in which no tenant was present, whereas the dark blue portion indicated the proportion of cases in which at least one tenant was present.
This graph shows rate of appearance depending on the day of month. It would appear that there are two main peaks in the above graph, namely the 11th and 29th of each month.
A peak in tenant appearance toward the end of the month could be explained due to pay dates. It may be possible that toward the end of the month, a tenant;s ability to not only appear in court but also show up with cash for the landlord and the ability to pay rent may cause an increase appearance.
As for the peak around the 11th, if some tenants are on bi-weekly pay checks, then a similar explanation as above regarding pay dates could be used. However, it may be that the dataset we have is too small to analyze exact appearance rates on specific days of the month. This is an area that would require further research in later studies. Of particular interest would be to research whether there is a relationship between tenant appearance in court and the timing of DSS payments.
Month of Year
Does the month in which a tenant is called to court affect tenant appearance? One might be interested to see how month of the year affects appearance. More specifically, the difference between winter and summer appearance rates could be of interest.
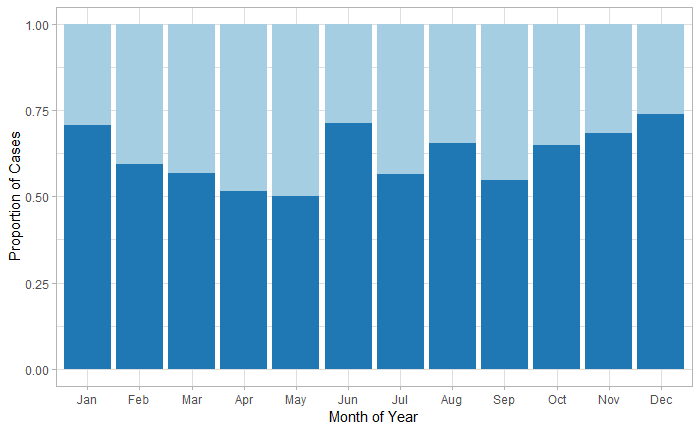
The light blue portion of the graph indicates the proportion of cases in which no tenant was present, whereas the dark blue portion indicated the proportion of cases in which at least one tenant was present.
This graph shows the rate of appearance according to the month of the year. As can be seen from the graph, it appears that January, June and December are the months with highest tenant appearance, and April, May and September have the lowest tenant appearance.
It seems that there is a seasonal pattern associated with this graph. If, for example, we were to omit June, July and August, we would notice a prominent curve in our graph. Our calculations suggest that the difference between appearance rates in the summer and appearance rates in mid winter in our sample is large enough that it likely reflects a similar difference in the full population of landlord tenant cases.
Initially, one might think that tenant appearance rates are affected by the school calendar, but as can be seen by our first graph, appearance rates are not affected by the RCSD calendar.
The seasonal variation displayed could be influenced by a tenants perception on the consequences of eviction during that particular month. For example, the consequences of being evicted in the winter months are much more severe than the consequences of eviction during the spring, summer and fall. It may be that tenants are more willing to show up in court to fight an eviction in the winter months, in order to keep a roof over their head during cold temperatures and the holiday season.
The shape of this graph raises several questions of which further analysis would be useful:
- If we were to take out the summer months (June, July and August) it would appear that we have a smooth curve from January to December; why do peaks appear in January, June and December?
- The University of Rochester is the largest employer within the City of Rochester, with some workers contracted less hours throughout June/July and mid-December/January; could this play a role in appearance rates throughout the year?
Weather
In order to analyze the effect of weather on tenant appearance in court, we collected data regarding climate throughout 2017 from the Rochester International Airport weather station. We matched several climate readings (precipitation, snowfall, snow depth, average wind speed, average temperature) with each case’s initial hearing date.
This data was collected from https://www.ncdc.noaa.gov/cdo-web/search.
Box plots have been used to show the relationship between tenant appearance and a climate variable. The box plots on this page can be interpreted as so:
- The shaded box represents the middle 50% of the data
- The solid black line in the box represent the median data point
- The lines that protrude from the solid box extend to where the maximum and minimum values of the data lie
- Any outliers in the data are represented by black dots
Precipitation
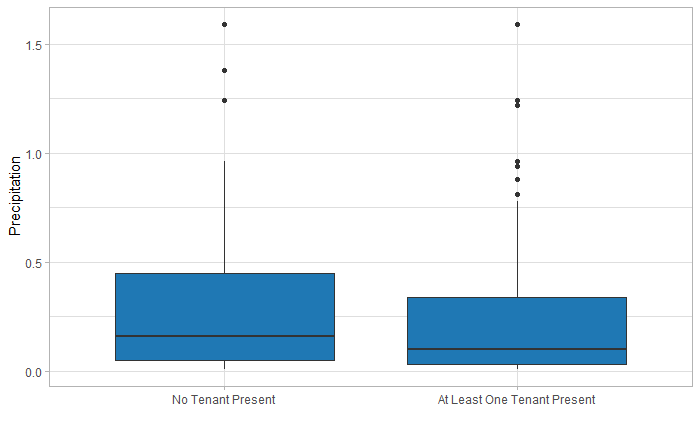
One might wonder if strong levels of precipitation prevent tenants from appearing in court. In order to consider this, a box plot of tenant appearance and precipitation levels was created.
The above box plot displays how tenant appearance varies with precipitation. The median precipitation level (in inches) is higher on the days of cases when tenants do not appear, than on days of cases when tenants do appear.
Snowfall
Although Rochester is well equipped to deal with heavy snowfalls, heavy snowfall could potentially impact timing and occurrence of regular public transit routes. For this reason, one might wonder how tenant appearance is impacted by snowfall throughout the year.
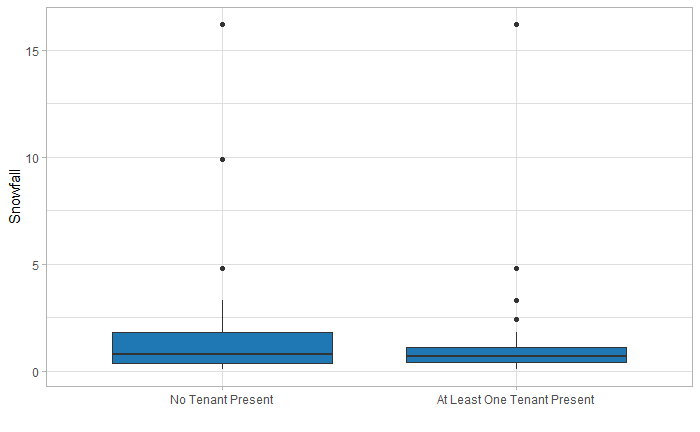
This box plot showcases the relationship between tenant appearance and rate of snowfall (in inches). It appears that the upper quartile of our first box is higher than our second, which would indicate that when snowfall is more intense, tenants not being present in court is more likely. However, this difference does not appear to be significant enough and would require further analysis.
Snow Depth
It may be possible that the depth of snow on the ground could again impact public transportation routes, as well as the ability for cars to get out of driveways, and for walking and cycling paths to the court to be inaccessible. Keeping this in mind, depth of snow could impact the ability for a tenant to appear in court on their scheduled day.
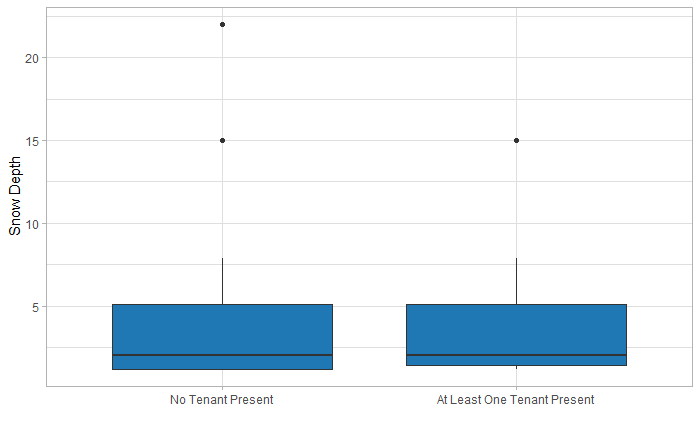
The above box plot shows the relationship between depth of snow (in inches) and tenant appearance. It would appear that the depth of snow does not play a significant role in the appearance of tenants in court. Being in upstate NY, Rochester tends to be proactive regarding clearing roads and pathways which may be one reason that snow depth does not have an impact on tenant appearance.
Average Wind Speed
Could higher wind speeds lead to less tenants choosing to appear in court? It may be that increased wind speed could be associated with storms, which could prevent tenants from appearing in court.
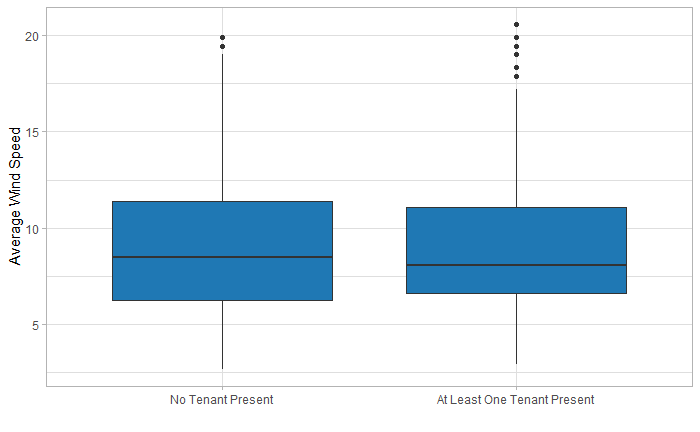
The above box plot shows average wind speed (m/s), and how it factors into tenant appearance. The difference between the two plots above is too small to signify that the difference holds in the full population of cases.
Average Temperature
One may initially believe that colder weather would prevent a proportion of tenants from choosing to leave their home to attend court. Colder weather also increases the chance of flu-like sickness to appear more often in people, which would be another factor that could possibly prevent tenants from appearing in court. To investigate whether any of these assumptions hold, a box plot of average temperate and tenants appearance was created.
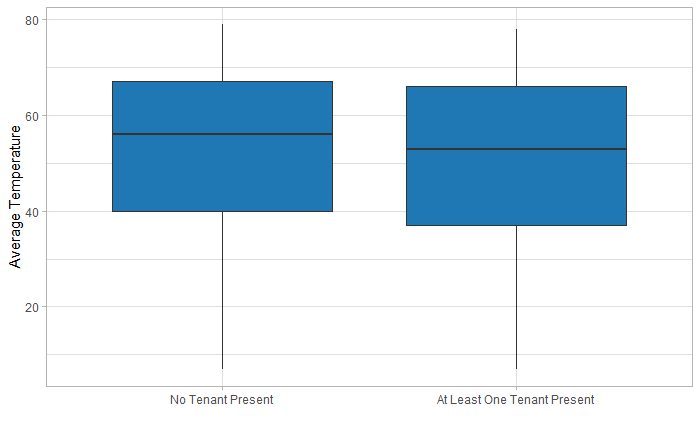
With regards to average temperature and tenant appearance, it would appear that the average temperature for the day has a slight impact on tenant appearance, with temperature being higher when no tenant is present for our cases.
This works against initial assumptions regarding weather; what factors are keeping people away from court when the temperature is higher? As mentioned before, in our analysis on seasonal variation, it may be that people are more encouraged to attend trials during the winter months (and hence, colder weather) because the consequences of eviction are much worse in the winter months.
