Forrest Hangen
Exploring the Relationship Between Demographic Data and Estimated Eviction Hearing Rates
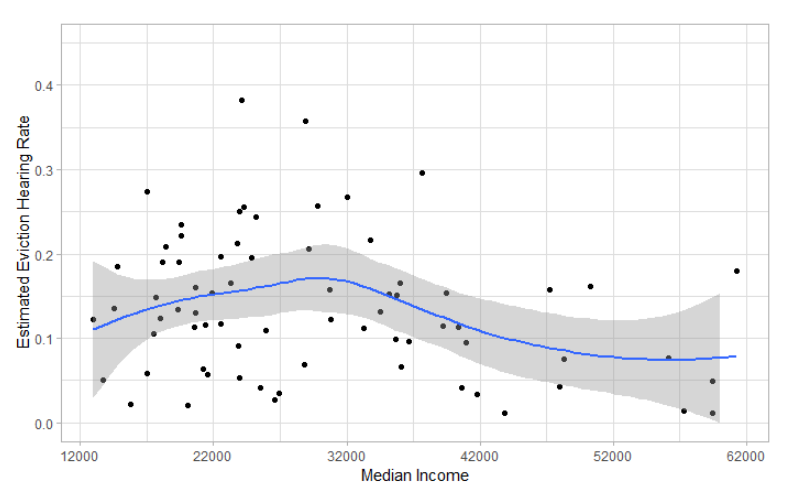
Census Tracts: Estimated Eviction Hearing Rate vs. Median Income

Eviction Hearings Are More Frequent in Lower Income Areas
Eviction hearing rates tend to be higher in census tracts where the income is lower than $42,000 per year. Notably, above $42,000 all eviction hearing rates were less than 20%, whereas below $42,000, eight census tracts had estimated eviction hearing rates above 25%.
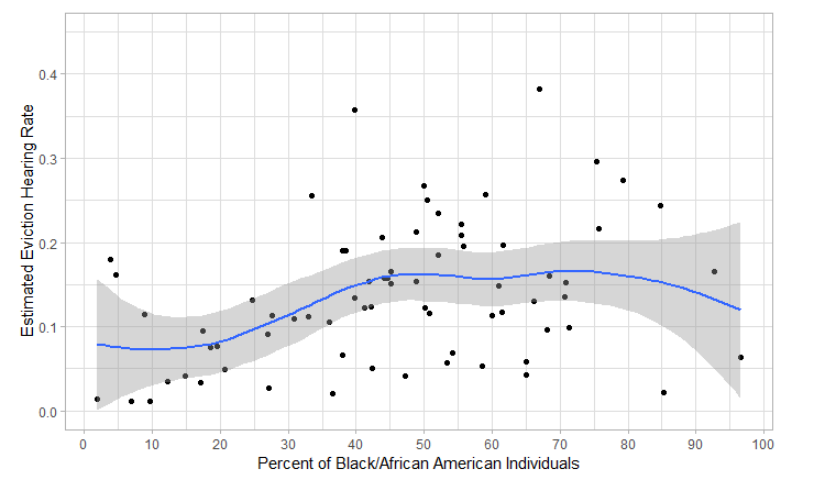
Census Tracts: Estimated Eviction Hearing Rates vs. Proportion of Black/African American Individuals

Eviction Hearings Are More Frequent Among Black/African American Populations
The majority of estimated eviction hearing rates above 20% were in census tract areas where over 50% of the population was Black/African American.
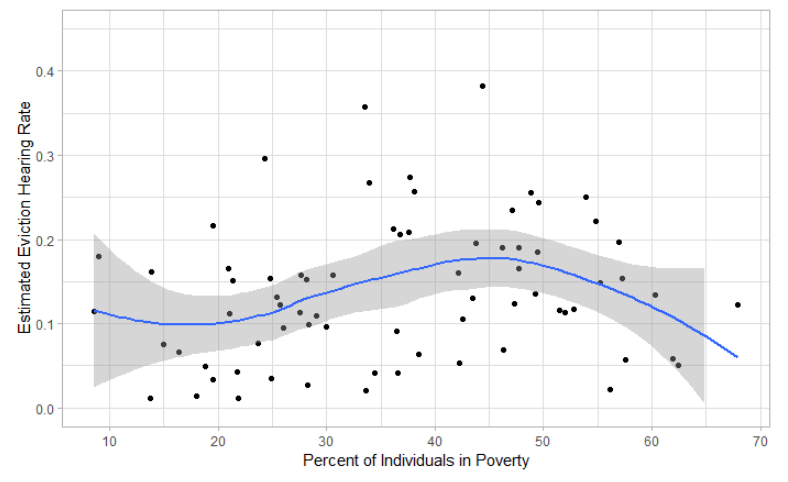
Census Tracts: Estimated Eviction Hearing Rates vs. Proportion of Individuals in Poverty

This scatter plot depicts the estimated proportion of eviction hearings per rental unit vs. the proportion of individuals poverty in each census tract. A single point represents a census tract in Rochester.
Eviction Hearings are More Frequent Among Individuals in Poverty
A majority of the estimated eviction hearing rates above 20% occurred in populations were more than 30% of the population was in poverty. For reference, the national poverty rate in 2017 was only 12.3%.
Methodology
All census tract level data (racial composition, poverty status, median income, etc.), with the exception of estimated eviction hearing rates, comes from the 2016 American Community Survey.
Estimated Eviction Hearing Rates were calculated by first calculating the number of eviction hearings in our sample in each census tract (N_sample). Then we estimated the number of eviction hearings in 2017 in each census tract by multiplying N_sample by the proportion of cases in each sample and by the number of total cases in 2017. We then estimated the eviction hearing rate per census tract by dividing by the number of rental units as found in the 2016 American Community Survey.