Beatriz Gil-Gonzalez
Tenant Gender and Eviction Case Outcomes
Previous research such as Desmond (2012) in ‘Eviction and the Reproduction of Urban Poverty’ has found that women are over-represented in eviction cases in Milwaukee, Wisconsin. Desmond’s (2012) study was unable to ask tenants in his cases what their gender was, and thus could only guess each tenant’s gender based on the tenant’s first name.
We do a similar process in our study, through which we first have a random selection of 717 cases. We take the name of every tenant in those cases and take a random sample of 134 of them. For each tenant we recorded the case outcome and we guessed the tenant’s gender based on the name. To start we analyze the proportion of guessed males vs. the proportion of guessed females in the population, which is shown by the graph below. The proportion of the names that we did not have a guess for is 27%.
Proportion of Respondents by Gender Guess
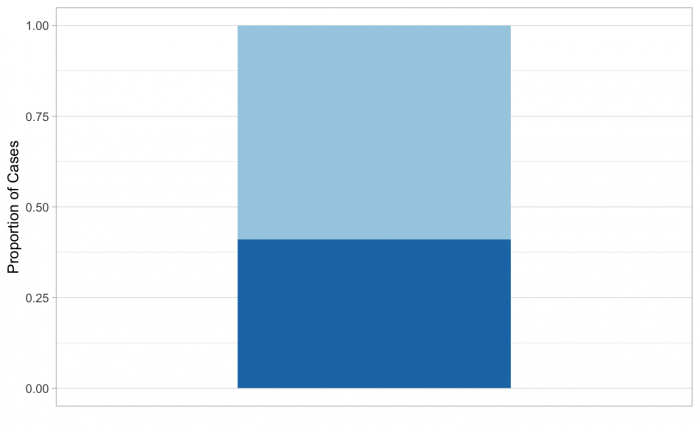
In the graph above, we can see that among the respondents with a guessed gender, only 40% of them are male. This suggests that about 3 out of 5 of the respondents in our sample are female. Thus, females are over-represented. This is consistent with Desmond’s findings and is very important as it suggests that females end up in Landlord-Tenant court more often than males.
Within our random selection 47% of the cases came were assigned in the gender guess process to be female, 44% male and 27% unknown. While 11.2% of the cases were dismissed, 56.7% were warrant and judgement, 17% were warrant only and 12.2% were withdrawn.
When we separate outcomes by gender, 25% of female respondents ‘win’ (get a withdrawal or dismissal) in their cases. It also seems that about a 22% of male respondents’ “win” (get a withdrawal or dismissal) in their cases. Given the small sample, only having 134 persons of whom we guessed the gender of 107, I would conclude that there are not large enough differences across genders in the rate of “win’s” (dismissal or withdrawal) in our sample to suggest that there would be any difference in the population.
Then we tried to see what the distribution of the amounts of judgements for males vs females is, through a frequency polynomial.
Frequency of Final Judgment by Gender Guess
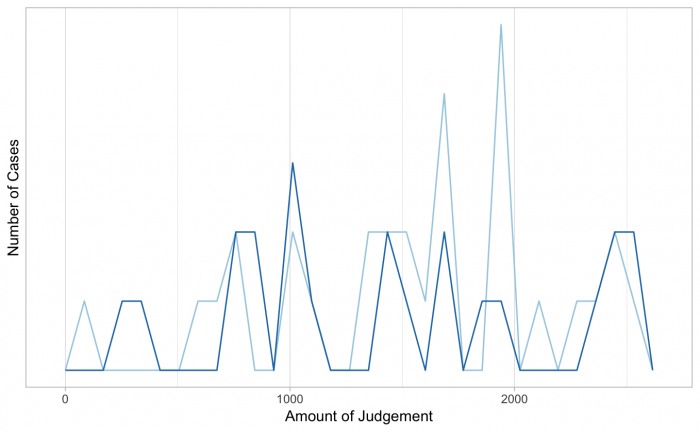
From this graph, it looks like there might be more large judgement amounts among female respondents than among male respondents.
Then we looked at the difference between mean and median judgement amounts across genders, excluding outlier judgements above 3000; The graph above excluded those outlier judgments as well.
Mean and Median by Gender Guess
| Gender Guess | Number | Mean Judgement | Median Judgement |
| Female | 34 | 1376.729 | 1499.12 |
| Male | 23 | 1379.067 | 1425.00 |
| NA | 11 | 1239.236 | 1145.00 |
In the above table, the means of the two genders are quite close together. But the medians are quite different, with the median judgement for females about $75 larger than that for males. Suggesting that in cases in which a relatively large judgement is granted, female respondents tend to get larger judgments than male respondents.
We thought it is worth checking whether this difference in median judgement across genders generalizes to the population. In our sample, the median judgement amount among guessed female respondents is larger than the median judgement amount among guessed male respondents. However, there is a large amount of variation in judgement amounts among both groups of respondents. For this reason, we cannot conclude from our sample that difference between guessed females and guessed males holds in the full population of all respondents in 2017 cases.
We also created a new variable that looks into the number of days from final hearing date to stayed-to date for each judgement and the warrant.
Frequency of Final Judgment Hearing Stayed by Gender Guess
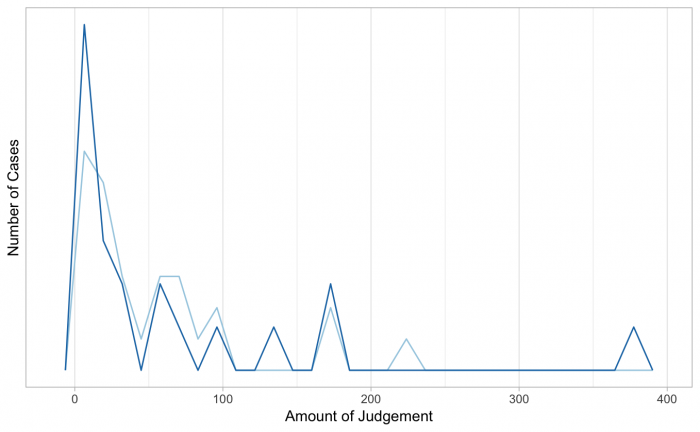
Looking at the graph above, we see no obvious differences across genders in the amount of time from the final hearing date to the judgment stayed-to-date. We then proceeded to do the same for warrant stayed-to-date.
Frequency of Final Warrant Hearing to Stayed by Gender Guess
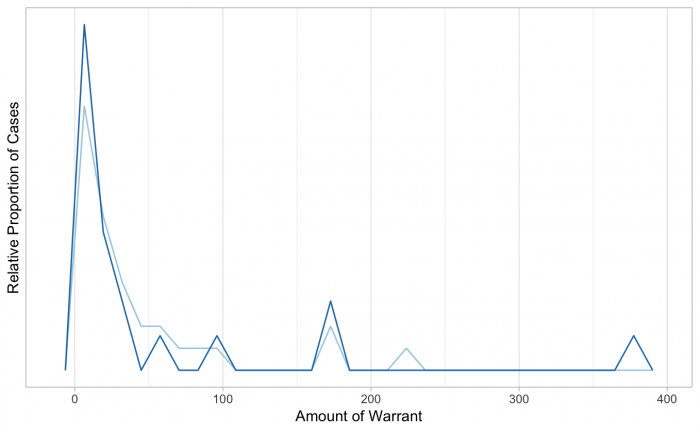
Looking at the graph above, we see no obvious differences across genders in the amount of time from the final hearing date to the Warrant Hearing stayed-to-date.
Works Cited
Matthew Desmond (2012). “Eviction and the Reproduction of Urban Poverty.” American Journal of Sociology 118:1, 88-133.